

This post explains what’s measured in Core Web Vitals, how to test your site, and what to do based on your results. It’s a long one, so you may want to grab a drink and get comfortable!
This guide covers:
- What is Google Core Web Vitals?
- How important is it for bloggers and solo website owners?
- What factors make up Core Web Vitals?
- How to check your Core Web Vitals scores
- What to focus on to improve Core Web Vitals
- How to improve your Core Web Vitals scores: a checklist
- Improving your site speed: help for non-techy people
Note: This post directly links to a number of lessons from our site speed course, Speed Boost. You definitely don’t need to be a course student to understand Core Web Vitals, benefit from this post, or action the things we’ve included below, but if you’re interested in getting a full understanding of site speed beyond what we’ve covered below, Speed Boost has what you need.
Speed Boost is free for Lyrical Host customers and gives more background and detail on site speed, including step-by-step details on running, understanding and actioning speed tests for non-techy types. Simply raise a ticket for free enrollment.
If you’re interested in optimizing your site for speed beyond the limitations of Core Web Vitals, check out our blog post The Blogger’s Guide To Speed Optimization once you’ve finished this one.
What is this Core Web Vitals thing?
For years, Google has been playing with how it wants to measure site speed and user experience. As of May 2021, it’s decided on a small number of speed- and user experience-related metrics that will actively be used as official ranking signals.
In short, this means some aspects of user experience can be measured using numbers and are officially used as one (of many!) factors to determine when and where your posts and pages come up in Google searches.
Core Web Vitals isn’t just about site speed. It’s designed to get you to think about how a user sees and navigates your web pages so you can make that experience as good as possible.
Currently reading: What Bloggers Need To Know About Google Core Web Vitals Share on X
How important is Core Web Vitals for bloggers?
Speed is a very popular focus in the blogging and SEO (search engine optimization) worlds at the moment, which means it’s in danger of being overhyped. While it’s great to have a speedy site from both user and search engine perspectives, it’s essential you don’t let it distract you from crucial tasks.
The reality is that all the things you know are important – doing solid keyword research, creating great content, and getting links to your website (from other good quality relevant websites) – are all things that will move the needle far more for you as a website owner. Speed is almost never the reason you aren’t seeing the rankings and traffic you’d like.
To sum up: if your website isn’t slow, don’t let yourself get obsessed or distracted by site speed, but focus on what matters – your content.
From Google (https://developers.google.com/search/docs/guides/page-experience):
“While page experience is important, Google still seeks to rank pages with the best information overall, even if the page experience is subpar. Great page experience doesn’t override having great page content. However, in cases where there are many pages that may be similar in relevance, page experience can be much more important for visibility in Search.”
Spending some time looking at, understanding and optimizing for speed in general and Core Web Vitals in particular is a good thing to do, but don’t let it take over. Don’t panic or worry, don’t let it make you hate blogging, don’t get obsessed. It’s not as big a deal as it may feel like, and you can and will be successful and have great rankings and traffic without having amazing CWV scores. This post is designed to help you build your knowledge in a manageable way, and eliminate any fear or worries you may have.
Looking at Core Web Vitals in context
Speed falls under the broader umbrella of User Experience (UX) in Google’s eyes, so it’s a small factor of SEO (search engine optimization) rather than a main factor. But it’s worth looking at if you haven’t optimized your website speed before or you’ve just looked at colors/grades instead of digging deep into your site speed.
Core Web Vitals is about much more than just site speed, which is likely why it doesn’t have a speed-related name. Broadly speaking, it’s a series of specific, measurable website metrics that Google is likely to add more to (or change) in the future. Framing your approach to think beyond speed – to the broader scope of user experience – will serve you very well long term as Google has had a significant focus on user experience for decades (for example penalizing sites for having too many ads, having intrusive pop ups on mobile etc.).
User Experience is a huge field in itself. It’s broadly summed up by how much a visitor enjoys browsing your website, but that translates as a whole bunch of things in practice. To give you an idea, it covers everything from button size to text color contrasts to accessibility to ads and pop ups to time on page, and beyond. This post just focuses on the few factors that Google is looking at in Core Web Vitals.
What factors are included in Core Web Vitals?
Site speed is a huge area, and there are a lot of different ways to measure it and factors to consider. Testing location, desktop vs mobile, dialup speed vs fiber broadband speed…and that’s even before you get into individual metrics and acronyms. Speed can vary a lot depending on the recipient, what’s happening on the site at the time it’s tested, what variable scripts (for example ads, which can be different every time) are loaded, how well the site is optimized, and so on.
Google has selected a small range of metrics to use in Core Web Vitals:
- Largest Contentful Paint (LCP)
- Cumulative Layout Shift (CLS)
- Total Blocking Time (TBT) and First Input Delay (FID)
We explain what these mean below, and then following that we include how to check what your site scores and a checklist of actions to improve your scores.
Largest Contentful Paint (LCP)
LCP is the point where the majority of the main content on your page has loaded. Google believes this should be lower than 4 seconds (and ideally lower than 2.5 seconds wherever possible).
This factor is considered important by Google because it indicates to the visitor that the page is actually loading; most visitors will start to engage with a page as soon as they can see something (rather than waiting till the page is fully loaded).
The largest element is typically an image or video, or perhaps a large block-level text element.
What does Google consider a good LCP score?
- Good: 2.5 seconds or less
- Needs improvement: 4 seconds or less
- Poor: More than 4 seconds
Cumulative Layout Shift (CLS)
This isn’t strictly a speed-based metric, but it’s related. CLS basically means how much your page jumps around while it’s loading. For example, if you lazy load images, the space these take up should be accounted for rather than the text jumping down the page as images are suddenly loaded in. This is because it’s annoying for users if they’re trying to read a sentence on a page and the text keeps jumping down as images are loaded.
For bloggers, the most common causes of bad CLS scores are poorly lazy loaded images or adverts. Many lazy loading image plugins these days handle it quite well, but if you want to improve your CLS score, that could be the first thing to look at.
If you have a poor CLS score and you’re with an ad network that has lazy loading for their adverts and/or requires you to lazy load your images, you may want to check with them what they recommend or what their roadmap is for improvements.
What does Google consider a good CLS score?
Unlike the other Core Web Vitals metrics, CLS isn’t based on seconds or milliseconds. Instead, Google rates CLS based on their own system, where 0 means no content shifting on the page and 1 means maximum shifting:
- Good: 0.1 or less
- Needs improvement: 0.25 or less
- Poor: Over 0.25
First Input Delay (FID) and Total Blocking Time (TBT)
These are very similar metrics, but TBT is a lab metric (i.e. tests you’re running on demand) and FID is only measured as a field metric (i.e. data aggregrated over time from Chrome users visiting your site). Some tests will use one and some the other; you can use either/or.
This is the time difference between a visitor interacting with your page (e.g. tapping/clicking a link) and the browser responding (e.g. understanding they tapped/clicked the link). Only things like pressing keys (e.g. to type in form fields), tapping, and clicking count towards this. Things that are continuous actions, such as scrolling or zooming, don’t count towards FID/TBT.
If a visitor doesn’t interact with your site, or doesn’t perform an interaction that’s relevant to FID, they will have no FID value. It’s also important to note that some users’ first interaction will be when your page is still loading things behind the scenes (more likely to result in a high – aka bad – FID) while other visitors’ first interaction will be after your page has loaded everything (more likely to result in a low – aka good – FID).
Therefore, FID can vary a lot and as such you may want to look at the top percentiles and trends in your Google Search Console report, rather than looking at individual values. Even still, it’s best not to get too wrapped up in the numbers for FID, especially if you don’t have many Chrome visitors to your site, as the numbers may vary wildly.
What does Google consider a good TBT/FID score?
- Good: 100ms or less
- Needs improvement: 100ms-300ms
- Poor: More than 300ms
How to check your Core Web Vitals scores
You can see your scores in speed tools and reports such as PageSpeed Insights, Google Search Console, WebPageTest.org and GTMetrix.
As Core Web Vitals is a set of Google metrics, it’s reasonable that you would want to assess it using one of Google’s own tools. All tools have their own pros and cons. The biggest downside to Google Search Console is that it’s only updated every 28 days. PageSpeed Insights is generally not a tool we recommend (you can find out more about that in Why Bloggers Should Ignore Google PageSpeed Insights, so if you’re using that, you’ll want to ignore everything except the three metrics listed in the section above).
Not sure which tool to use? We recommend WebPageTest.org, because it’s real time, comprehensive, and has the most options, but Google Search Console also has its own Core Web Vitals report, which is pretty useful if you don’t want to get distracted by other speed metrics and numbers just yet. As it only updates a maximum of every 28 days, don’t expect to see any changes you’ve made show for a while.
Core Web Vitals scores will display in your speed test results after entering your URL; you just need to look for “LCP,” “CLS” and either “FID” or “TBT” and grab the numbers from next to them. Note that it defaults to “Mobile” rather than “Desktop;” so you’ll need to toggle between the two. Google’s mobile testing is done on a slow 3G connection, so don’t panic if you see some numbers you don’t like the look of as the majority of the world uses mobile speeds faster than 3G.
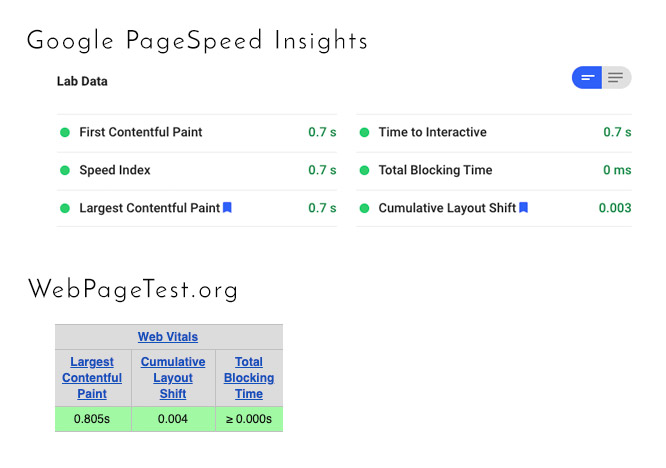
Example results in PageSpeed Insights and WebPageTest.org for our test site, freepixels.org
Important: Always check you have the correct URL for your site in your speed test. For a speed test, if you enter https://www. when your site is actually https:// for example, it will throw off your numbers as it will be jumping through redirects.
At this point, don’t let yourself get distracted by any other numbers, colors, grades, scores, etc. If you’re interested in improving other scores in your tests, we have some resources linked at the very end of this post. This is so you don’t feel overwhelmed – let’s take it one step at a time!
Some notes on speed testing tools and Core Web Vitals
– In waterfall testing tools such as WebPageTest and GTMetrix, FID is likely to be referred to as TBT (as explained above in the FID/TBT section).
– In Google tools, each Core Web Vitals metric is given a status: Good (green), Needs Improvement (yellow) or Poor (red). For Google Search Console, if there isn’t enough reporting data for a metric/URL, it’s left out of the report.
– If you don’t have Google Search Console, see how to install it with our Google Search Console tutorial; you’ll then need to wait for data to be collected and used to populate your results.
– If you’re enrolled on our speed course, you’ll find more info on using Google Search Console reports for Core Web Vitals in our lesson Speed Reporting in Google Search Console.
– GTMetrix is a reasonable testing tool (albeit restricted in terms of testing locations), but it’s worth noting that for some reason they use different numbers to Google for Good/Needs Improvement/Poor on Web Vitals metrics, so something they consider bad, Google could consider good. For this reason, you’ll want to use the Good/Needs Improvement/Poor benchmarks listed in this post or from Google directly, rather than their scores.
Once you’ve checked your scores, make a note of the numbers and whether they fall under “Good,” “Needs Improvement,” or “Poor” before moving on to the next section.
What to focus on to improve Core Web Vitals
To improve your Core Web Vitals scores, there are three main areas of site speed you want to focus on. These are:
- Reducing your page size
- Reducing the number of page requests
- Reducing your Time To First Byte (TTFB)
Below we look at what each of these things are, and then we follow that with a list of tasks to improve your Core Web Vitals scores.
Reducing Your Page Size (Helps your LCP and FID/TBT scores)
Everything you add to your page, for example images, scripts, videos, increases its page size. Regular text only adds a very tiny amount to your page size, so don’t worry about that.
For a WordPress site, your page size should be under 2MB (you can check your page size using WebPageTest.org), but the smaller the better. We cover the main ways to reduce your page size in the next section.
If you’re a Speed Boost student, there’s a full lesson here: Reducing Your Page Size.
Reducing your page requests (Helps your LCP and FID/TBT scores)
Page Requests are all the files and scripts your page is asking for (for example Google Fonts, images, and so on).
An external request is when your website asks another website for something, for example loading a Google Web Font or an advert from your ad network. Internal requests are typically things like you adding an image from your media library to your page; your page still has to search for it and find it to display it. All requests add to the total regardless of whether they’re internal or external.
Reducing page requests can be a bit more of a challenge, so if you’re a Lyrical Host customer and have questions or need help, please raise a ticket.
If you’re a Speed Boost student, here’s a quick link to the full lesson about this: Reducing Page Requests.
Reducing your TTFB (Time To First Byte) (Helps your LCP score)
TTFB, also known as “Time To First Byte” or “First Byte Time”, is the time it takes for the server to return the first byte of data for your page (i.e. the soonest possible moment your page can start loading).
This element of your site speed correlates to your web hosting, caching and theme.
Speed Boost student? Here’s a quick link to the full lesson you need: Reducing your TTFB.
What about CLS?
If you’re eagle-eyed, you may have noticed that CLS isn’t mentioned in any of the three areas above. This is for two reasons: it’s not directly a speed metric, and it’s generally pretty easy to improve your score (if needed) using the tasks mentioned in our checklist below.
Core Web Vitals Checklist
The checklist below is a list of actions. Next to each action is a key to tell you which Web Vitals metrics (LCP, CLS and/or FID/TBT) can be improved by completing that action. We’ve done it this way because one action can improve multiple metrics, so we’re not repeating tasks and so you know what big win actions you can take to improve multiple metrics at once.
Side note: If you’re a Lyrical Host customer, you can download a handy PDF version of this checklist from the customer Resource Library. If you’re a Speed Boost student, key lessons are linked for you too.
01. Proper image optimization (Reduces page size; helps LCP, FID/TBT)
Generally, the biggest culprits of page size are large images. This is often an issue for people who upload images straight from their phones, but even if you don’t, one image you’ve forgotten to optimize can massively increase your page size. For more on image optimization, see How To Optimize Your Images For The Web or if you’re a Speed Boost student, Optimizing Your Images.
(Key points: Resize your images to the dimensions you need before uploading, “Save for web” in a graphics program before uploading. Then let an image compression plugin compress further. A plugin will only compress so much, so you need to resize and pre-optimize your images before uploading).
02. Remove unnecessary images & media from pages (Reduces page requests & page size, helps LCP, FID/TBT)
Removing images you don’t really need from your posts and pages helps both page size and requests, resulting in a faster website. Even if they’re small and well-optimized, having lots on one page adds up.
03. Make site-wide reductions (Reduces page size & helps LCP, FID/TBT)
Check your header, footer, and sidebar to see if you can remove any unneeded images or widgets. Even if you can only remove or reduce one or two things, this can make every page on your site a little faster so it’s worth considering.
04. Minify & combine code (CSS & JavaScript) (Reduces page size, page requests, & helps LCP, FID/TBT)
You can do this with a plugin such as Autoptimize. Combining your JavaScript can sometimes break your website, so check your site in a new browser after enabling it to make sure it still works. If it doesn’t, disable it again, and raise a support ticket so we can take a look (or if you’re not a Lyrical Host customer, you may want to contact a developer).
(Speed Boost student? The lesson you need is: The WordPress Speed Plugins That Actually Help).
05. Check plugins (Reduces page requests & helps LCP, FID/TBT)
Make sure you only have plugins you really need. If your test results show a lot of requests from one particular plugin (you can identify them by the name in the filepath), you may want to switch it out or remove it if you’re concerned (it’s up to you).
06. Remove any unused Google Fonts (Reduces page requests & helps LCP, FID/TBT)
If you have Google Fonts you don’t use listed in your speed test, you should remove them.
07. Use the correct URL for Waterfall Testing (Affects TTFB & therefore LCP)
If you’re using a testing tool such as WebPageTest or GTMetrix and you’ve entered your URL in the incorrect format, it will force the test through unnecessary redirects, which will affect the number you’re seeing for TTFB (This is an easy fix; just re-run the test with the correct URL, e.g. https://www. or https:// depending on what you set for your site).
(Speed Boost student? Head to the lesson: Running A Speed Test).
08. Check Caching (Reduces TTFB & helps LCP)
Non-existent or wrongly configured caching can be a big problem. Always talk to your host before installing any caching plugin, as they may already have it covered.
For example, we always recommend sticking to our caching if you’re hosted on our WordPress platform, as it’s more effective for sites hosted with us than any third party plugin). Installing multiple caching plugins or having multiple sources handling caching can cause your site to be slower.
Just having a caching plugin active doesn’t necessarily mean it’s set up and working correctly. If you have a high TTFB score, it’s likely that your site isn’t being cached correctly. Please ask our support team for help if you’re a Lyrical Host customer, and if not ask your host to check your site is hitting the cache.
(Speed Boost student? Take a look at this lesson: Caching Pros & Pitfalls).
09. Remove plugins that break caching (Reduces TTFB & helps LCP)
Some plugins set cookies in a way that causes caching to break, for example certain ad networks. If you’re a Lyrical Host customer, please raise a ticket if you have concerns about this.
10. Check you have full SSD web space (Reduces TTFB & helps LCP)
Some hosts say they offer SSD web space but only provide it for the cached version of your site. If your host only provides cached SSD space or doesn’t provide it at all, your TTFB will be heavily affected. In this instance you should consider switching plans or hosting. All Lyrical Host plans include full SSD space, so if you’re one of our customers no action is needed.
11. Block/remove unneeded requests (Reduces page requests: LCP, FID/TBT)
Some plugins load scripts on pages they aren’t needed. The worst culprit for this is WooCommerce, which loads its scripts on all posts and pages instead of just on your product listings and checkout pages! Some themes handle this automatically, but if you run WooCommerce and you’d like this checked and fixed, please raise a support ticket if you’re a Lyrical Host customer. If you’re not, you may want to hire a developer as this can make a big difference to your site speed.
12. Check advert requests (Reduces page requests & helps LCP, FID/TBT)
If you don’t have display ads (such as Google Adsense), skip this. If your speed test shows a high number (hundreds) of requests from your ad network, speak to them about it or consider switching.
13. Optimize your database (Reduces TTFB & helps LCP)
The easiest way to do this is using a plugin like WP Optimize. Simply install, run, and deactivate again.
14. Check lazy loaded images and ads (Affects CLS & LCP)
Bad lazy loading can increase your CLS score; good lazy loading can improve your LCP. If you manually write the code for images, you always need to specify a height and width for them to avoid increasing your CLS.
Not all lazy loading image plugins are created equal; Smush can cause site issues for example. A3 Lazy Load is good, as is Lazy Load by WP Rocket (which is separate to their caching plugin). If you run ads on your site and don’t believe your high CLS is due to images, it’s worth contacting your ad provider for recommendations.
15. Remove/avoid content pushers (Helps CLS)
Avoid/remove features that push content down the page, for example large opt-in bars.
Improving your site speed: advice for non-techy people
While optimizing for CWV is a good start, you’ll want to make sure your website is well-optimized for speed across the board. Not only does this mean a better experience for your visitors in general, it helps you future-proof your site should Google decide to add other metrics into CWV as you’ll already be ahead of the game and won’t have a bunch more work to do or things to learn.
Plus, you have the added benefits of better user experience (your visitors will be happier and stick around longer), less environmental impact (smaller pages mean less bandwidth and device power needed and therefore lower electricity use), and less cost to your visitors using pay-as-you-go data (it costs more to load bigger pages).
We always recommend that as a blogger, you learn about site speed yourself instead of or before you hire someone to look at it for you. This is because you need to understand how to make the best decisions for your site instead of inadvertently undoing or counteracting the optimization work you’ve paid someone else to do. It also means you can identify great people to hire, know for yourself if they’ve done a good job, and feel confident in the terms they’re throwing around. There are many site speed experts who will simply throw affiliate links for plugins or web hosts at you, send you a report you don’t understand, and take your money.
We have a detailed blog post on site speed for bloggers, and if you’re looking for a step-by-step guide of everything you need to know (with all the jargon turned into simple English and direct action steps you’ll find easy to implement even if you’re not techy), we have a very cheap course called Speed Boost. If you’re a Lyrical Host customer it’s totally free for you, just raise a support ticket.
If you’re a Lyrical Host customer and you really don’t have the time to look at site speed and it’s not sinking in, we sometimes (depending on current workload) do personal site speed and improvement reports for a very reasonable fixed cost. This involves analysis of your site, a fully written-for-you report (no automating, no complex tech speak), and a list of easy actions to improve your site speed. Just raise a ticket to check availability and find out more.

Speed Boost is our site speed course, which is free for Lyrical Host customers and very affordable for others too! It’s a text-based course that has helped hundreds of students dramatically increase their site speed. For more information, take a look at what’s included.
Did you find this post useful? Pin it for someone else to discover:


No Comments